Get interated predictions from a GP model (or MSY from a "fisheries model")
predict_iter.RdObtains iterated predictions for given a GP model. Can also be used to obtain MSY estimates from a "fisheries model".
predict_iter(object, newdata, xlags = NULL, hrate = NULL)Arguments
Value
A list (class GPpred) with the same elements as predict.GP.
Details
The predicted value is inserted into the first lag of the next timepoint, and the other lags are shifted right by one. The method thus assumes that all time lags are present, evenly spaced, and in order; that all timepoints to be predicted are evenly spaced; and that the response variable and time lags are in the same units.
Using this method requires the use of data with pre-generated lags
(option A1 in fitGP), that a time column is specified,
that newdata has exactly the same columns as data. The names of
the columns containing the lags (which will be iteratively updated) can be
indicated under xlags; if omitted, all columns originally supplied
under x are assumed to be lags. If your model contains covariates,
(values that are not time lags of the response variable) you will need to
specify xlags, which should not include the covariates. You don't have
to do this for "fisheries models" though, because lags (m) and covariates
(h,z) are have already been specified.
Some care needs to be taken in the construction of newdata, which is
what is used for prediction. Predictions will be made for as many timepoints
as are in newdata, starting with the first timepoint. Only the first
row of the xlags columns (for each population) needs to be complete.
The subsequent rows can be NA, or have values in them - those values will be
overwritten as the model iterates. If you have covariates, values for those
need to be supplied for those at all timepoints.
Obtaining MSY from a fisheries model:
If you are fitting a "fisheries model", the values of h should be set to some
constant value for all time points in newdata. At each iteration, the
values of m will be updated with the predictions, and the quantity m-bh will
be computed to obtain the next prediction. If covariates (z) are present,
values should be supplied for them. The value of xlags is assumed to be m.
Examples
xdata=makelags(data = thetalog2pop, y="Abundance", pop="Population", time = "Time", E=3, tau=1, append=T)
xdatatrain=subset(xdata, Time<=40)
xdatafore=subset(xdata, Time>40)
tlog=fitGP(data = xdatatrain, y = "Abundance", x=c("Abundance_1","Abundance_2","Abundance_3"),
pop = "Population", time = "Time", scaling = "local")
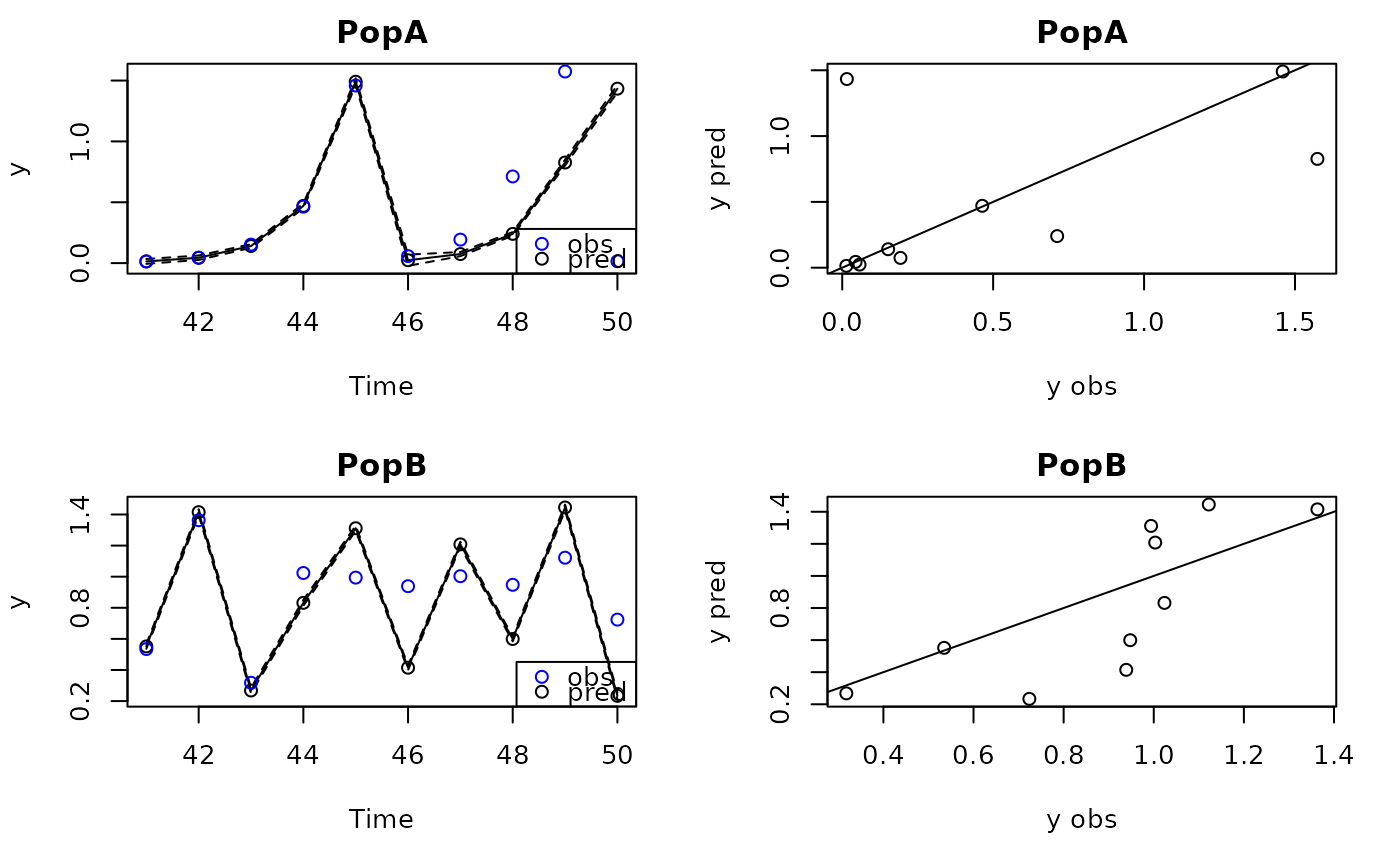
prediter=predict_iter(tlog,xdatafore)
plot(prediter)
#> Plotting out of sample results.